The Pacer answers production questions from your own data.
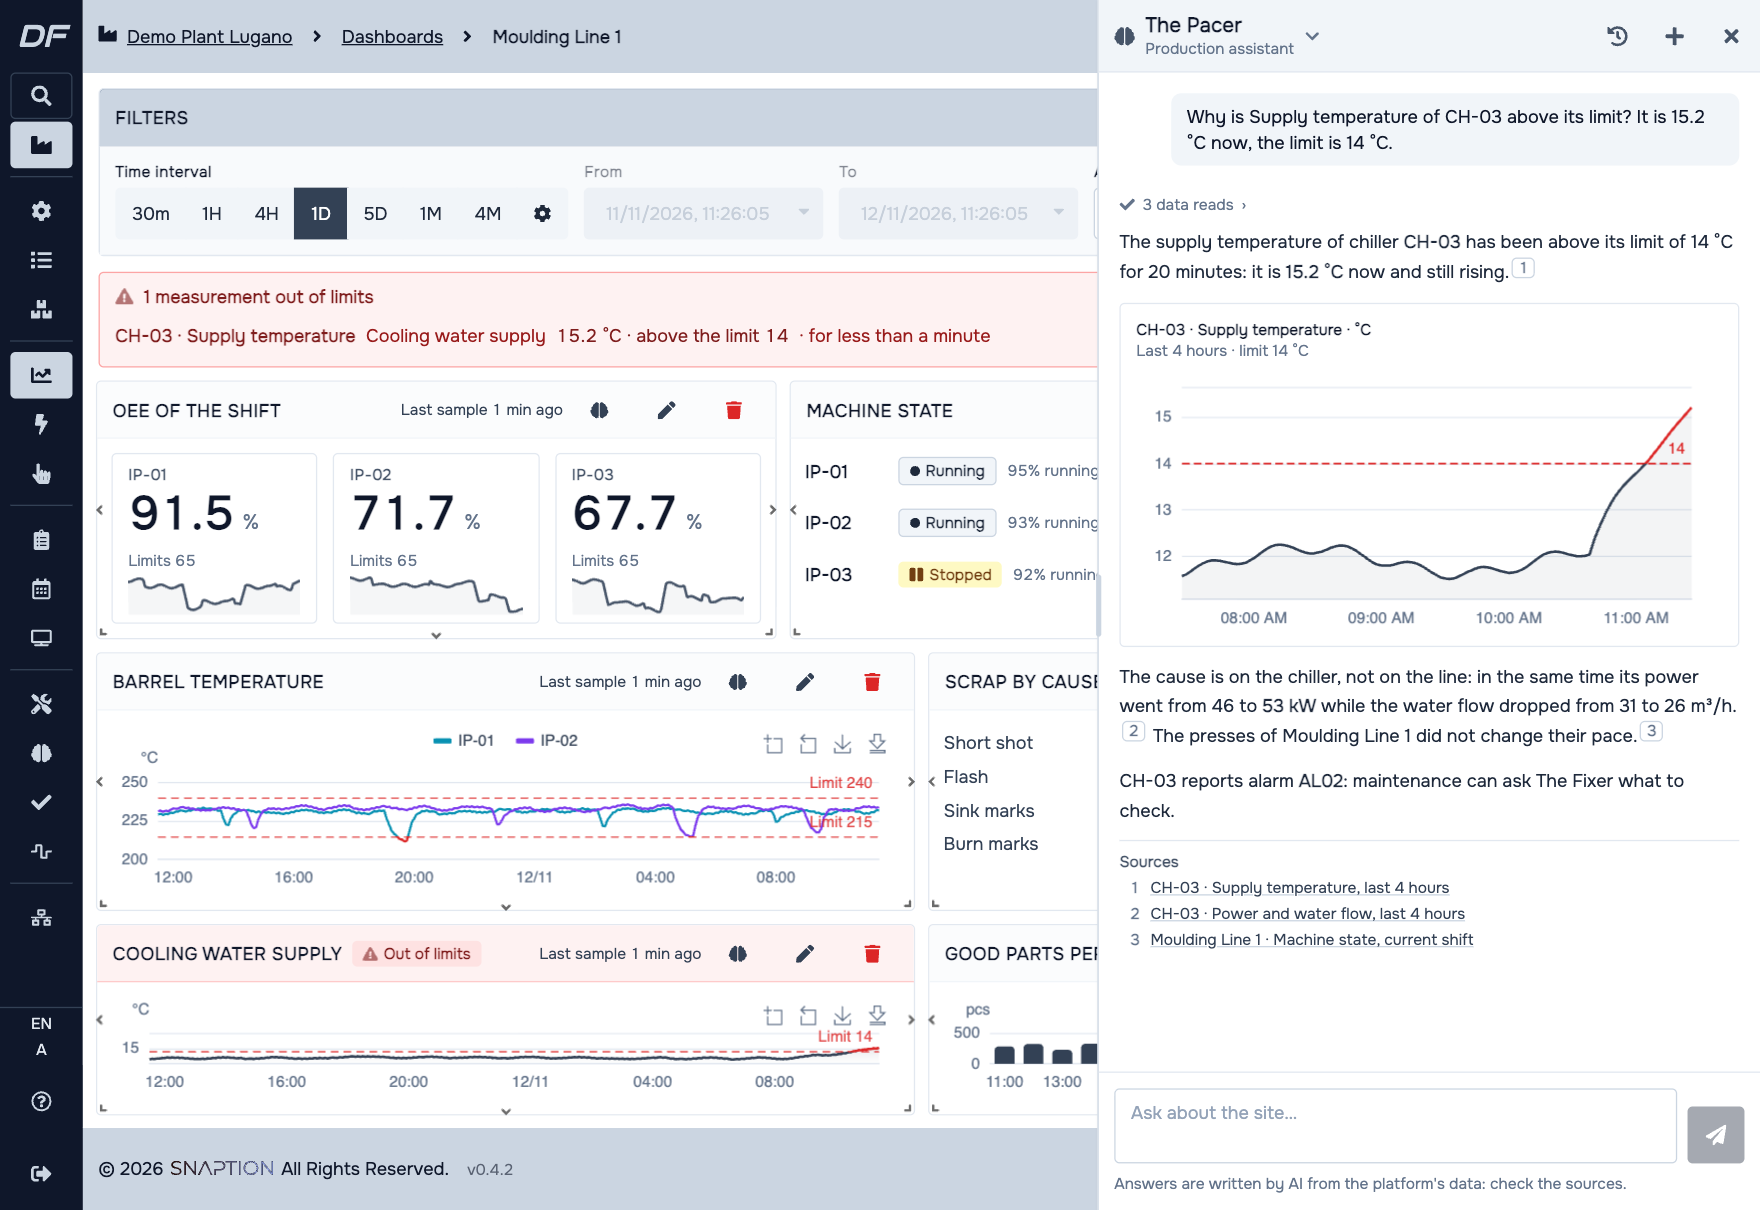
Ask how things stand, why a resource is slowing down or where an order has got to. The Pacer reads the site's data and answers in a few sentences, telling you where every figure comes from.
For the shift supervisor, the production manager and the planner.
Why is PR-02 slowing down?
PR-02 has averaged a cycle time of 14.8 s in the last 15 minutes, against 12.1 s yesterday on the same product.1
The oil temperature has been above the dashboard limit since 09:40. The two moved together, so take this as a hypothesis to check at the machine.2
- 1PR-02, production monitoring
- 2Press line dashboard, oil temperature panel
Illustrative example. Equipment names, documents and values are invented.
What to ask
How things stand now
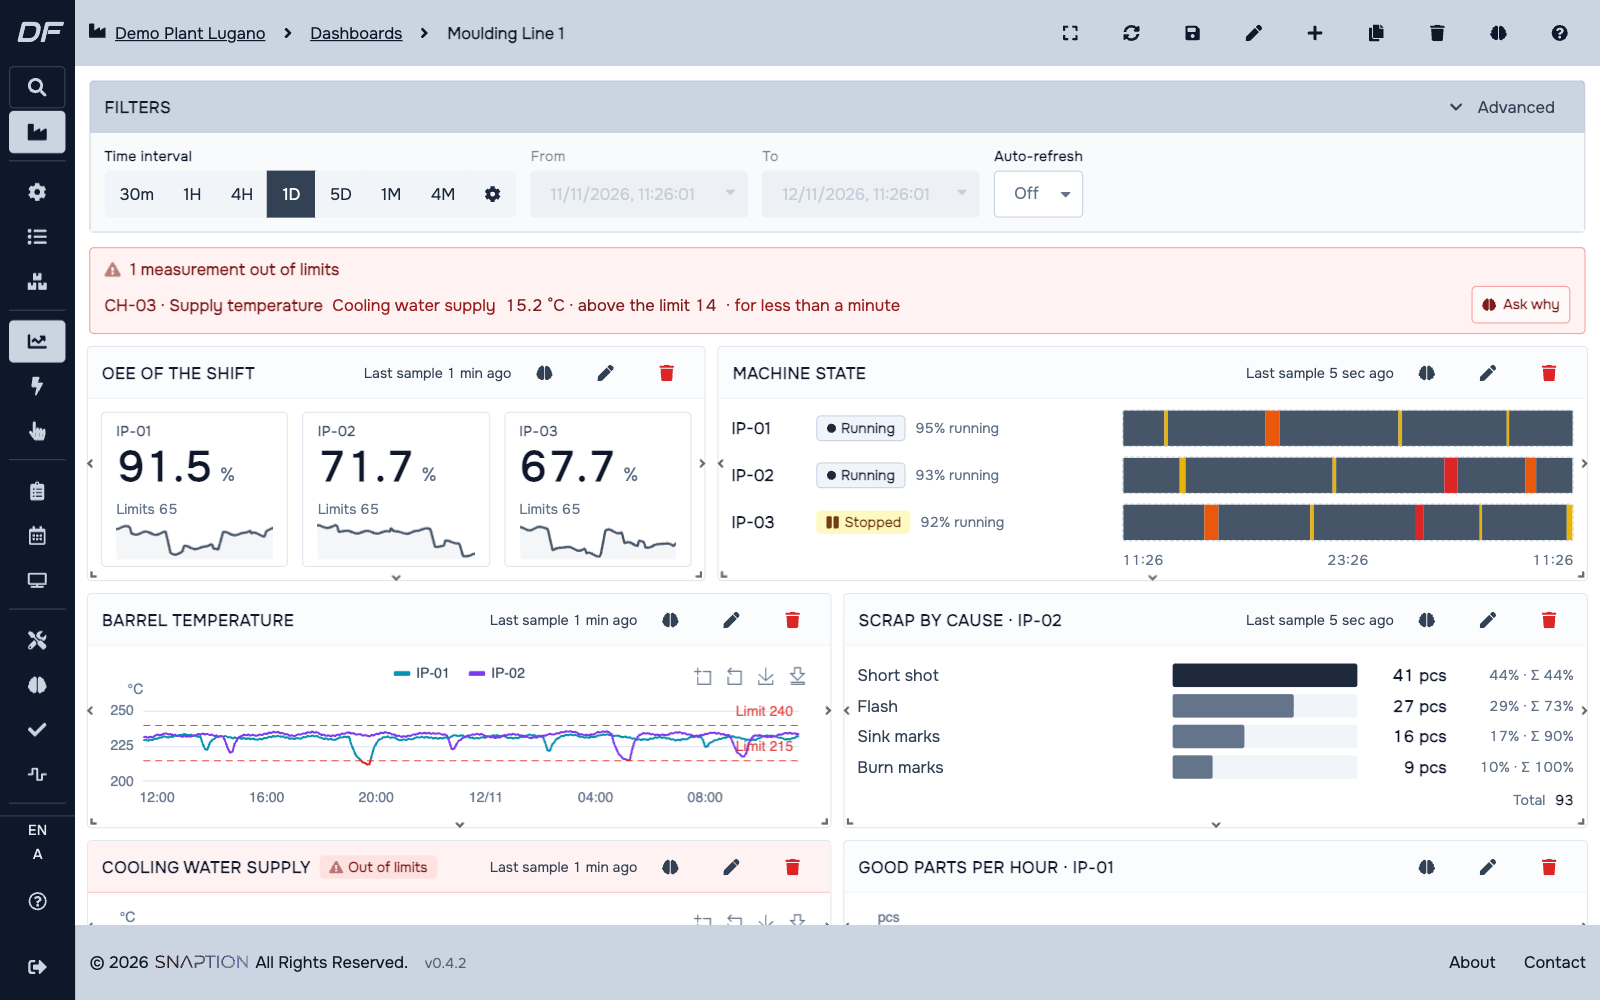
"Which resources are stopped?" It reads the state and latest values of every resource and points out those outside the dashboard limits.
Why
"Why is PR-02 slowing down?" It compares measures and states with a normal period, such as another day or a twin resource, and looks at the last 15 minutes apart.
What changed
"Which defects went up this week?" It compares counters, such as parts and defects by type, with the previous period.
Stops and states
"Which resources stopped today, and why?" It works out time running, stopped, in alarm, in setup or off shift, with the alarm codes.
Orders and products
"Where is order OP-1024?" It reads orders with their steps, and routings, rates and bills of materials from the Catalog.
Charts
"Show me yesterday's cycle time." It prepares the chart from the data it read. The numbers come from the data, not from the AI.
How an answer reads
- Answers are short and appear as they are written.
- Every sentence with a figure carries a numbered mark that opens the page the data comes from.
- When a chart says it better, the answer shows one, with the dashboard limits and the stretch out of limits.
- If data is missing or stale, it says so. A link between two measures is given as a hypothesis, not as a certainty.
What it never does
- It only reads. It does not change orders or plans and does not command machines.
- It sees what you see, because it uses your permissions.
- It answers when you ask. It does not watch resources on its own and sends no alerts: dashboards and their limits do that.
The modules it works with
See DigiFactor on your own data.
Book a demo with our engineers. We show the platform, the modules and the agents on a case close to yours.
Book a demo We answer within one business day