Dashboards that each role builds for itself.
Put live panels on a grid and read machine data and business data side by side. No report requests, no code.
What it does
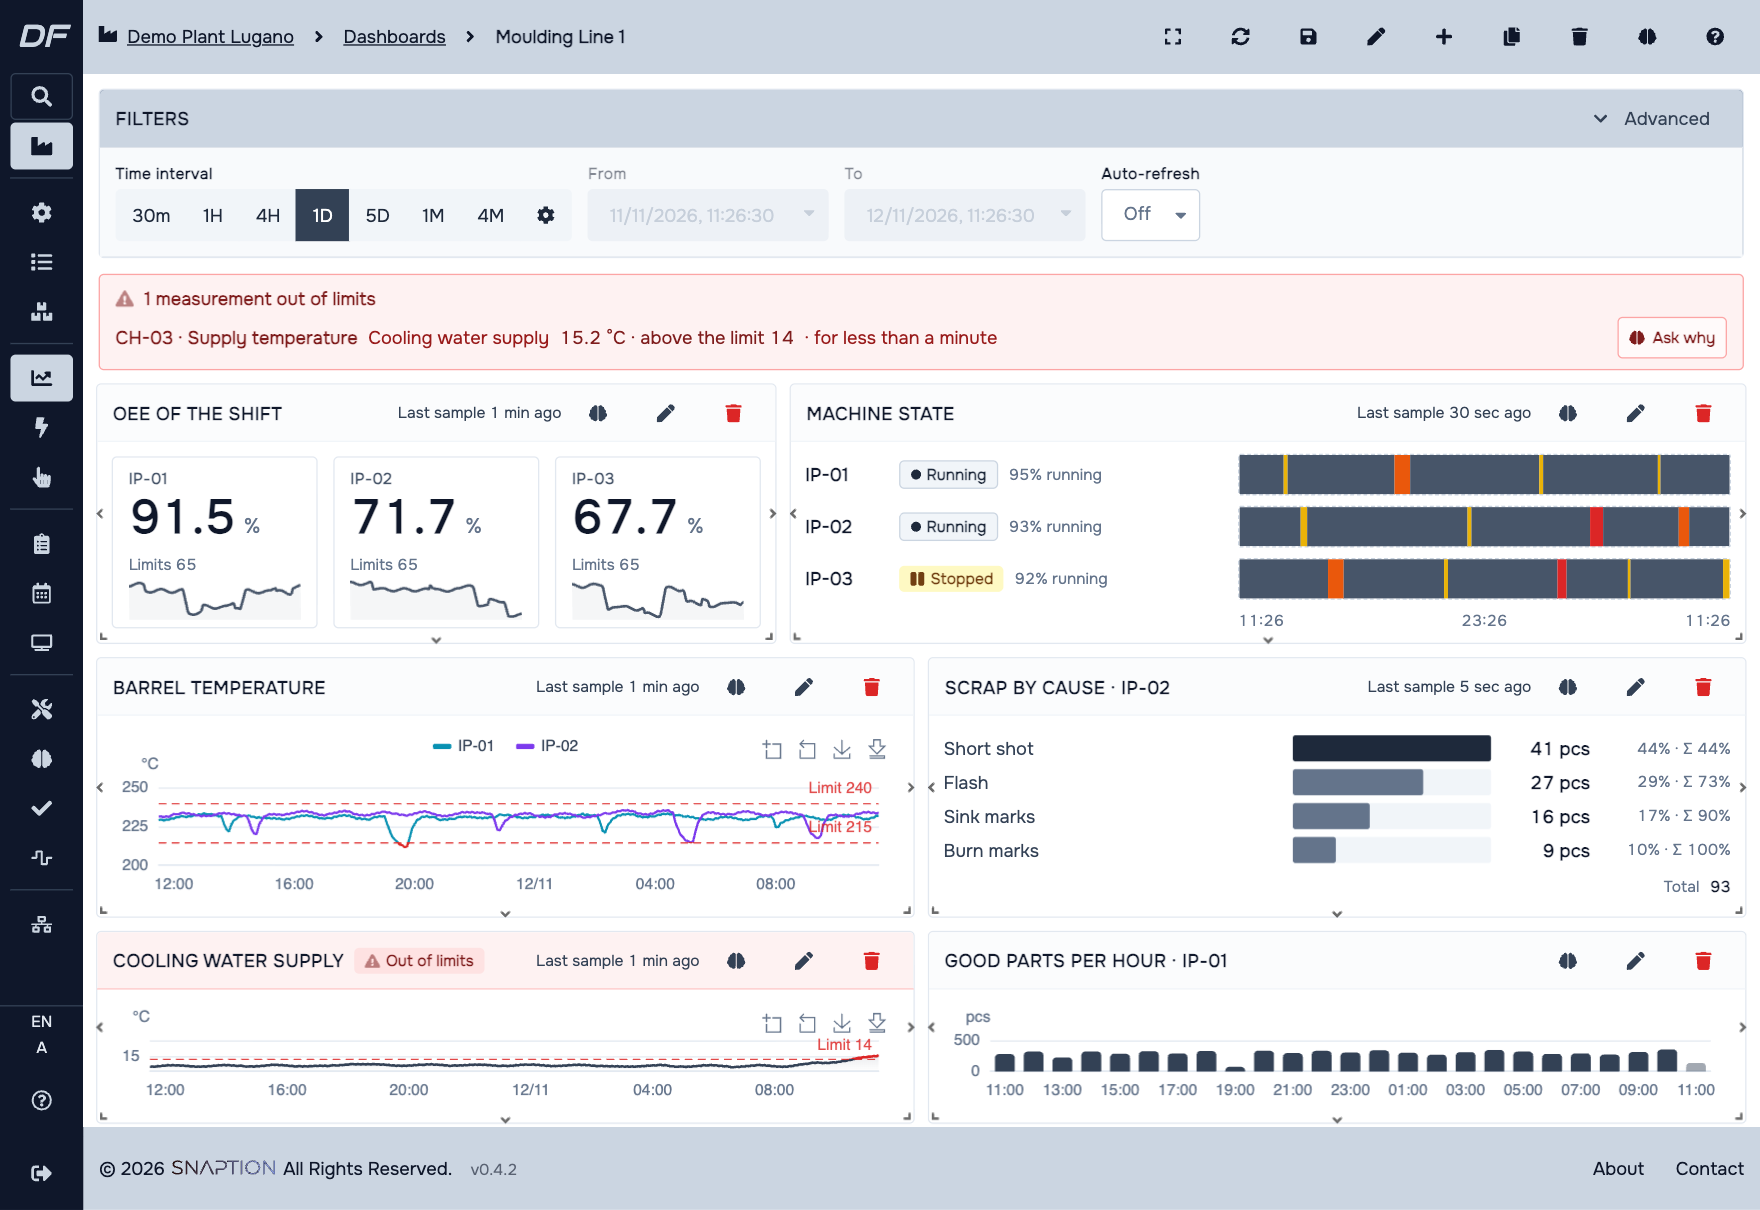
Panels on a grid
KPI, sensor chart, state, Pareto, bar and Sankey panels, arranged freely and resized on a 12 column grid.
Ready KPI panels
Machine OEE and area OEE, calculated around the clock or on working hours only, plus test counts and pass rates.
One filter bar
A single period and equipment filter drives every panel. A dashboard can be duplicated and adapted.
Limits on a measure
Set limits on a panel. Measures out of range appear in the alert strip, where you can ask The Pacer why.
Explore
Answer a one-off question on the data without building a panel first.
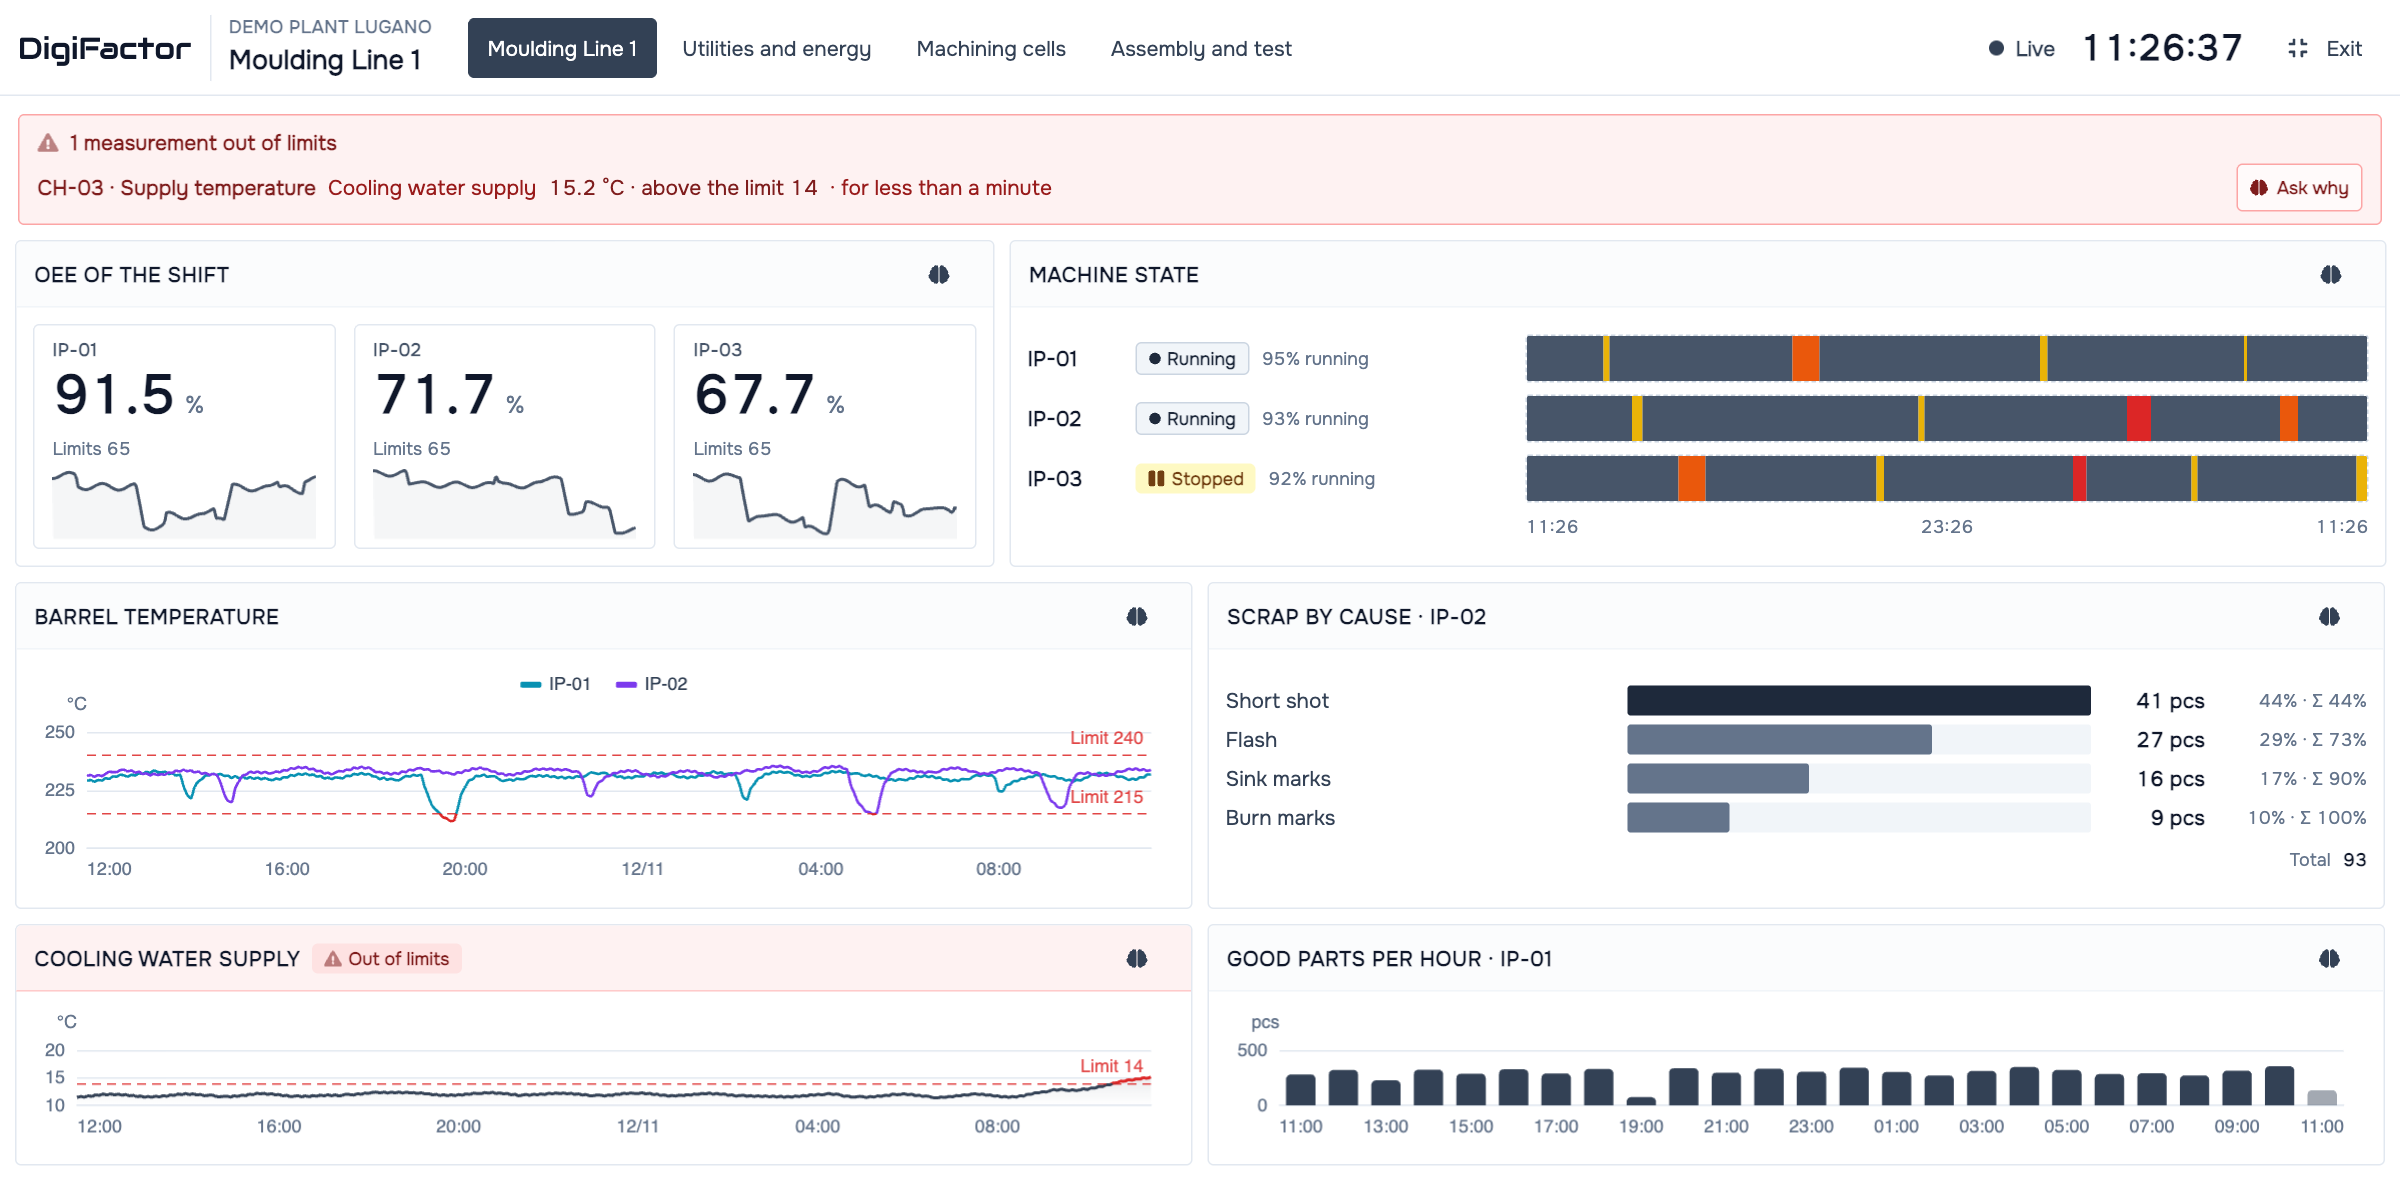
Floor view
A full screen view sized for a monitor on the shop floor.
The data it stands on
Like every module, it reads the shared ISA-95 model. Nothing is copied into a separate database.
- Live variables subscribed from each machine
- OEE from production activities and the shift calendar
- Test results from Quality management
What it measures
- OEE per machine and per area
- Live sensor values
- Test counts and pass rate
- Flows between stages
The agent that works with it
From an alert or a sensor panel, The Pacer explains how a measure moved over the period shown and why it left its limits.
See DigiFactor on your own data.
Book a demo with our engineers. We show the platform, the modules and the agents on a case close to yours.
Book a demo We answer within one business day